Project Description
🚗 Power BI Infographic: Insights on Car Sales Performance!
Interactive dashboard I developed in Power BI, focused on car sales performance. It provides clear and actionable insights to optimize strategies and improve results in the automotive industry.
🔑 Key features:
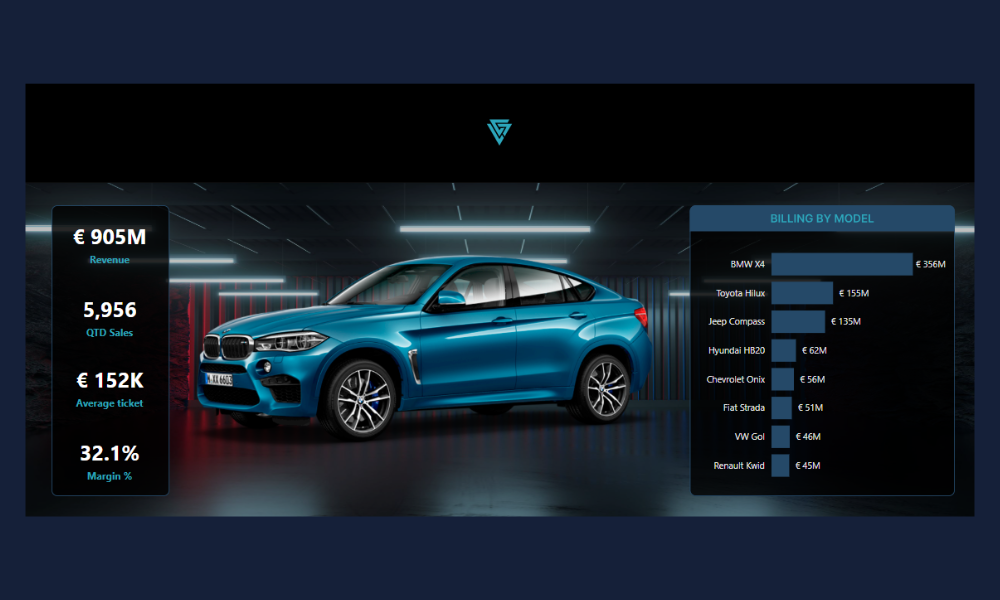
Performance Metrics: Track revenue, sales volume, and average ticket per vehicle.
Trends Analysis: Compare results across time periods to identify patterns.
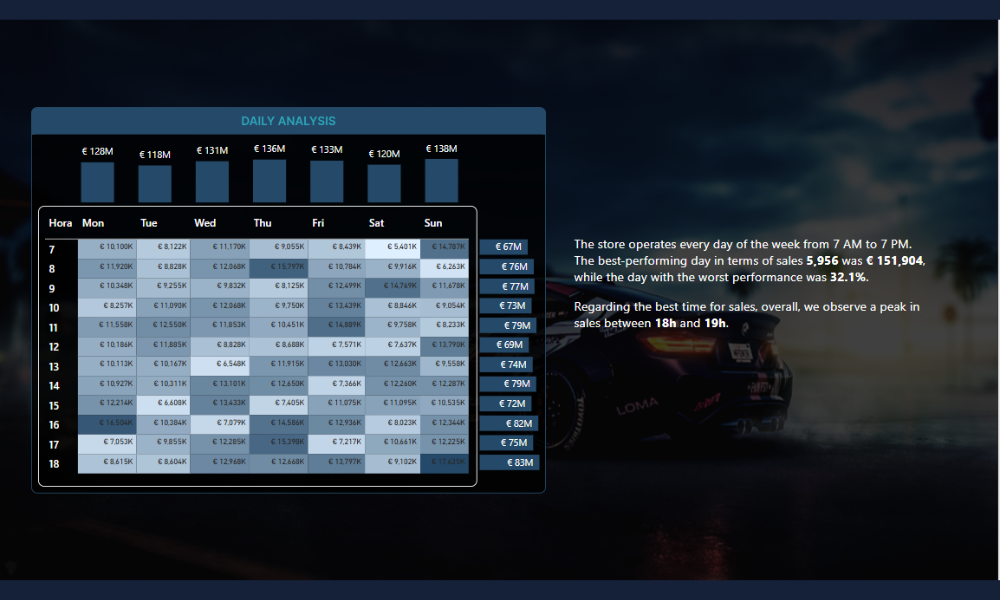
Best Days & Hours: Discover peak sales days and hours for better operational planning.


Open the Project on Power BI on line
Power BI on line